Module 3 — Reading the Chart
Candlesticks 101
105 words • ~0 min read
Every candle tells a 1-period story: open, high, low, close.
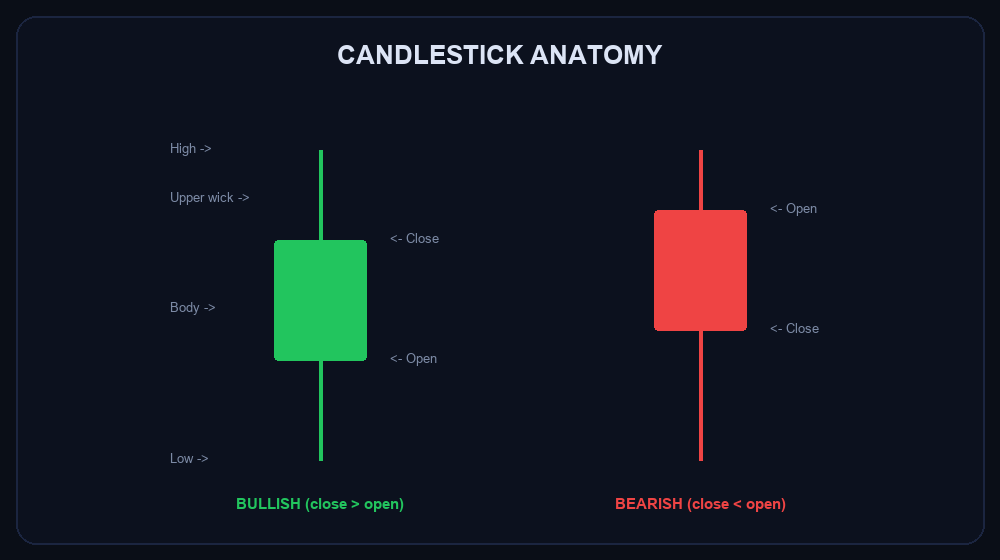
Anatomy of a candlestick: body, wicks, open/close
• Green = price closed higher than it opened (buyers won). • Red = closed lower (sellers won). • The body = open→close range. The thin wicks = the extremes price reached and got rejected.
What wicks whisper
A long lower wick = buyers stepped in hard (rejection of lows → possible bounce). A long upper wick = sellers slammed it (rejection of highs → possible drop). Wicks are where the fight shows.
A long lower wick = buyers stepped in hard (rejection of lows → possible bounce). A long upper wick = sellers slammed it (rejection of highs → possible drop). Wicks are where the fight shows.
You don't need 50 patterns. You need to read momentum: are bodies getting bigger green or bigger red? That's the trend talking.
Save this lesson for offline reading
Course content
M1 — Foundations
M2 — Your Platform — Optionly Walkthrough
M3 — Reading the Chart
M4 — Entries & Timing
M5 — Risk & Money Management
M6 — Signals & Your Roadmap